The bitcoin price looks bad, but I’m buying. Price might go lower, it always can, but there is value at these levels, and I’m accumulating. I think it’s important to be honest about how I’m actually acting on the analysis I publish, rather than just presenting data from a distance. And right now, the data is saying something that has only been said a handful of times in Bitcoin’s entire history.
Let’s cut to the chase:
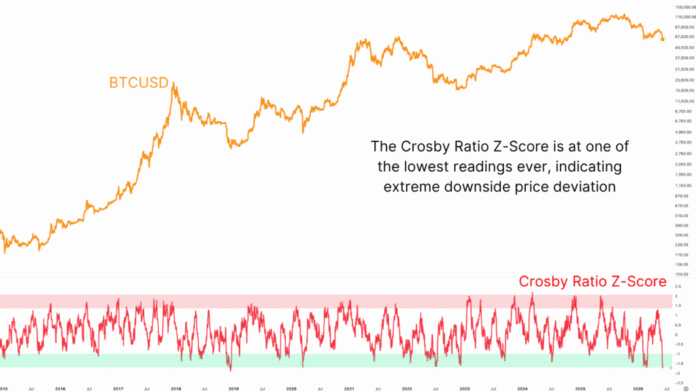
- The Crosby Ratio Z-score has one of the lowest readings in history.
- The RSI is at a level we’ve only encountered a handful of times in extreme market lows.
- Bitcoin has bounced off the 200-week moving average.
- The SOPR is in the bottom fifth percentile of all historical readings.
- The Mayer Multiple is also in its bottom fifth percentile.
The Crosby Ratio
The Crosby Ratio Z-score measures bitcoin’s price momentum and standardizes it for Bitcoin’s evolving volatility. It’s not a fixed threshold as it adjusts as the market matures and volatility compresses, making it applicable across every stage of Bitcoin’s history. The current reading is around -1.7. This means 99.8% of all days in Bitcoin’s history have registered a less extreme reading on this indicator.
Figure 1: The Crosby Ratio Z-Score has just dipped to one of its lowest ever values.
The list of instances where this reading has been as low: the recent drop to $60,000, the first break below $20,000 in 2022, the COVID crash in March 2020, and the 2018 bear market low. That’s it. Four occasions in over a decade of price history. Every single one of them turned out to be a significant accumulation opportunity.
The RSI
The Relative Strength Index is one of the most widely used momentum indicators across all markets. Bitcoin’s weekly RSI is currently at one of the lowest levels ever. The previous instances of readings this low were the 2015 bear market low, the 2018 bear market low, the COVID crash, and the recent drop to $60,000.
Figure 2: The Relative Strength Index is comparable to historical lows.
Two independent momentum indicators, measured completely differently, but producing the same short list of historical comparisons. That kind of confluence across methodologies isn’t something to dismiss.
The 200-Week Moving Average
The 200-Week Moving Average has served as bear market support throughout Bitcoin’s history. The only meaningful exception was the FTX collapse in late 2022, which caused a brief but sharp undershoot before a rapid recovery. Outside of that event, this level has held as a floor every single cycle.
Figure 3: Bitcoin currently sits just above its 200WMA.
View Live Chart
Bitcoin has just bounced off that level again. Directly beneath current prices sits the recent cycle low, creating the structure for a potential double bottom, one of the more reliable technical formations across any market. The 200-week moving average and the Bitcoin Realized Price converge in approximately the same zone, adding further weight to this level as meaningful structural support.
SOPR & The Mayer Multiple
The Spent Output Profit Ratio is currently in the bottom fifth percentile of all historical readings. This means the rate of realized losses across the Bitcoin network, the pace at which holders are selling at a loss, is in the deepest 5% of anything we’ve ever recorded. The selling that has driven this move has been predominantly short-term in nature; value days destroyed data confirms that long-term holders have largely not participated in this liquidation. These are short-term traders and leveraged positions being cleared out, and not the conviction holders capitulating.
Figure 4: The Spent Output Profit Ratio illustrates the severity of recent losses.
View Live Chart
The Mayer Multiple, which measures bitcoin’s price relative to its 200-day moving average, is simultaneously in its own bottom fifth percentile. When these two indicators have historically been in their lower extremes at the same time, the resulting accumulation opportunities have been exceptional. It has happened only a handful of times, and each instance has been followed by significant price appreciation.
Figure 5: The Mayer Multiple has reached levels corresponding to previous bear cycle lows.
To Sum It Up
I’ll be honest, the strength of the decline surprised me. I anticipated a pullback from the $80,000 resistance zone, but the move through $70,000 was sharper than expected. What hasn’t surprised me is the data that’s emerged as a result, because this kind of confluence across technical, on-chain, and momentum indicators has appeared before, and the market has consistently rewarded accumulation at these readings.
Could we go lower? Yes. The realized price sits not far beneath current levels and represents the next meaningful support zone if the low is revisited. I’m prepared for that scenario. But removing all emotion and looking purely at what the data is saying, five independent signals simultaneously in generational territory, this is not the moment to wait on the sidelines for a marginally better price.
Subscribe to Bitcoin Magazine Pro on YouTube for more expert market insights and analysis!
Disclaimer: This article is for informational purposes only and should not be considered financial advice. Always do your own research before making any investment decisions.